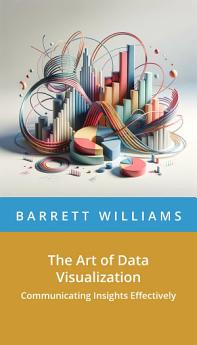
The Art of Data Visualization: Communicating Insights Effectively
About this ebook
Dive into the essentials with an introduction to the power of data stories and the evolution of data visualization. Unearth the science behind visual perception and master the core principles of effective chart creation. Transform raw numbers into meaningful narratives by understanding your audience and choosing the right visualization tools. With a deep dive into design for clarity and impact, learn to harness the power of color theory and accessibility to craft visuals that are both beautiful and interpretable.
Experience the art of simplicity with real-world case studies revealing the magic of "less is more." Develop your skills in storyboarding, planning the journey of your visualization from concept to completion. Explore how the worlds of data journalism and interactivity can engage audiences like never before. Anticipate and overcome common visualization challenges, including avoiding misleading graphs and troubleshooting potential pitfalls.
Delve into transformative case studies and explore the future trends in the field, including the role of AI. Discover ethical dimensions to ensure your data visualization practices are both accurate and honest. Apply your newfound skills across different domains such as finance and healthcare, striking a balance between emotional and analytical perspectives.
"The Art of Data Visualization" inspires action and encourages data-driven decisions through insightful, emotionally resonant storytelling. Empower yourself to connect with your audience and drive meaningful change with every visualization you create.


